

Using AI to extract insights at scale
Most AI data dumps produce slop. Here's a pattern that turns qualitative data into consistent, structured output.


The most valuable AI projects I’ve worked on so far all center on extracting qualitative insight at scale.
It’s about more than metrics. We’re all drowning in metrics (win rates, conversion rates, etc.). The struggle is understanding why those numbers move.
These insights are something almost every company wants and needs more of, but the path to get there is difficult.
The “why” lives in qualitative data: discovery calls, notes, emails, meeting transcripts, the messy human language where buyers tell you what’s actually going on. But qualitative analysis doesn’t scale. You can listen to ten calls and form an intuition. No one has time to listen to a thousand.
People try to solve this problem with what I call the “Magic 8 Ball Data Dump”. They take all their data, chuck it into Claude, and trust the answer that comes out. This can work for small data sets, but for larger ones, the output is inconsistent and not reliable enough to guide real decisions.
The LLM will produce something that sounds plausible, but it’s based on partial sampling and biased toward whatever signals stand out. You also have no audit trial of HOW it arrived at those conclusions.
What’s needed is a way to reliably apply something close to human judgment across a volume of qualitative data that a human team couldn’t process manually.
I’ve developed an approach to this and used it in a number of contexts. In this example, we’ll apply it to sales discovery calls to extract Category Entry Points (the situations that cause buyers to enter our category and consider us.)
We built this for our marketing team last year to inform brand strategy, and it’s since become a core input into how we think about go-to-market.
More broadly, this pattern — turning qualitative inputs into structured insight at scale — is one of the highest-leverage applications of AI I’ve found.
Background: the problem with brand measurement
Let’s talk about why we selected Category Entry Points as a use case and why this analysis matters for any go-to-market team.
The most useful model I’ve found for thinking about brand strength is from Byron Sharp and Jenny Romaniuk. They describe brand strength as a function of mental availability — how easily your brand comes to mind in a buying situation. Their research shows that mental availability strongly correlates with market share and growth.1
If your brand doesn’t come to mind when a buyer enters the market, you’re not even in the set of options being considered.
Brands live in your head as memories
According to Sharp and Romaniuk, a brand exists in a buyer’s mind as a set of memory structures — associations that link the brand to specific buying situations.
For example, when you think “I need a ride to the airport,” Uber comes to mind.
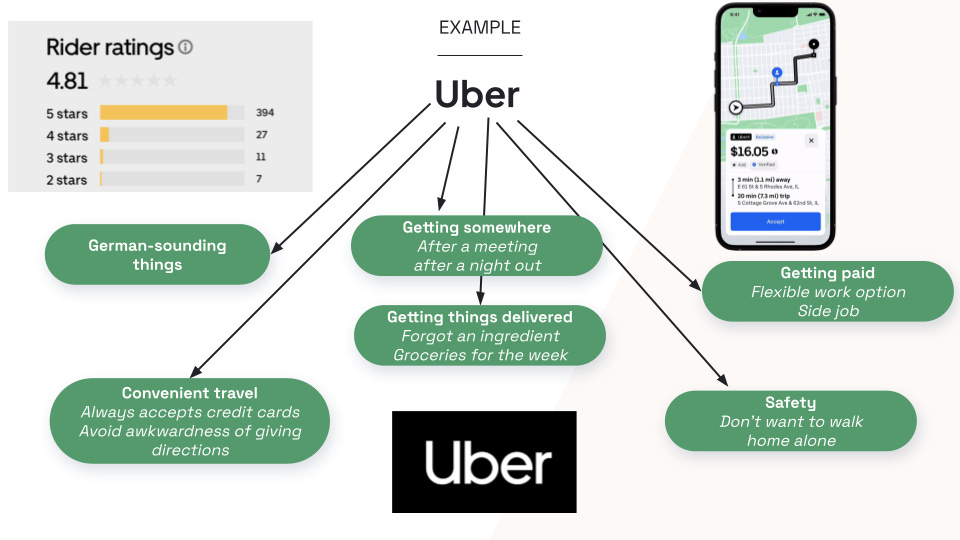
When you think “I’m hungry between meals,” Snickers comes to mind. When you think “I need to power through this afternoon,” Starbucks comes to mind.
Sharp and Romaniuk call these buying triggers Category Entry Points, or CEPs. They’re buyer-defined, not seller-defined. And they happen before the brand is recalled.
The brand that comes to mind first has the best chance of winning, because in most categories, buyers don’t compare every option on a spreadsheet. They pick from the set of brands they already have in their head.
Example CEPs
For the purpose of building our workflow, let’s take as an example a fictitious product: Acme CRM, an AI-first CRM. Some CEPs for that category might look like:
“I hate my legacy CRM.”
“My reps never want to enter data.”
“The UX is so bad people are working around it in spreadsheets.”
“We just hired a new VP of Sales and everything is getting re-platformed.”
“Our current tool bills per seat and we’re bleeding license costs.”
“We keep getting surprised by deals we should have forecasted.”
The goal of the brand marketer is to proactively associate their brand with those CEPs. That way, when a new VP of Sales walks into a team meeting and says “I hate our legacy CRM, I can’t get anyone to actually use this thing,” someone will immediately say “we should check out Acme.”
How to use CEPs as a marketer
Knowing your CEPs enables you to answer some important questions.
What buying triggers are associated with our best customers and highest win rates? These are where you double down.
Which ones lead to low win rates and churn? These are segments you may want to retreat from.
Which potentially valuable CEPs are we not showing up for at all? That’s work you haven’t done yet.
If we’re targeting specific CEPs with our campaigns, are we seeing a corresponding increase in inbound inquiries referencing them? That’s how you measure whether your brand marketing is working.
So the real question becomes: how do you actually find out what your CEPs are?
Workflow: How to build this
This process is based on the premise that discovery calls are the single richest source of CEP data most B2B companies already have.
Think about what happens in a discovery call. A prospect gets on a Zoom with a rep and tells them why they’re looking, what broke, what they tried last, and what specifically tipped them into being in-market this quarter. That is CEP data. You cannot buy this data from a research firm. You already own it, and it’s sitting in Gong (or Chorus, or Fathom, or Grain).
The problem is it’s unstructured. So nobody uses it at scale. You can’t query “show me all the CEPs that came up in Q1 discovery calls” from a bunch of video recordings. And even if you dump all your transcripts into Claude, you won’t get reliable answers.
Our goal is to have a resilient way to convert unstructured qualitative call transcripts into something we can query like quantitative data, so humans can think clearly about it.
The architecture
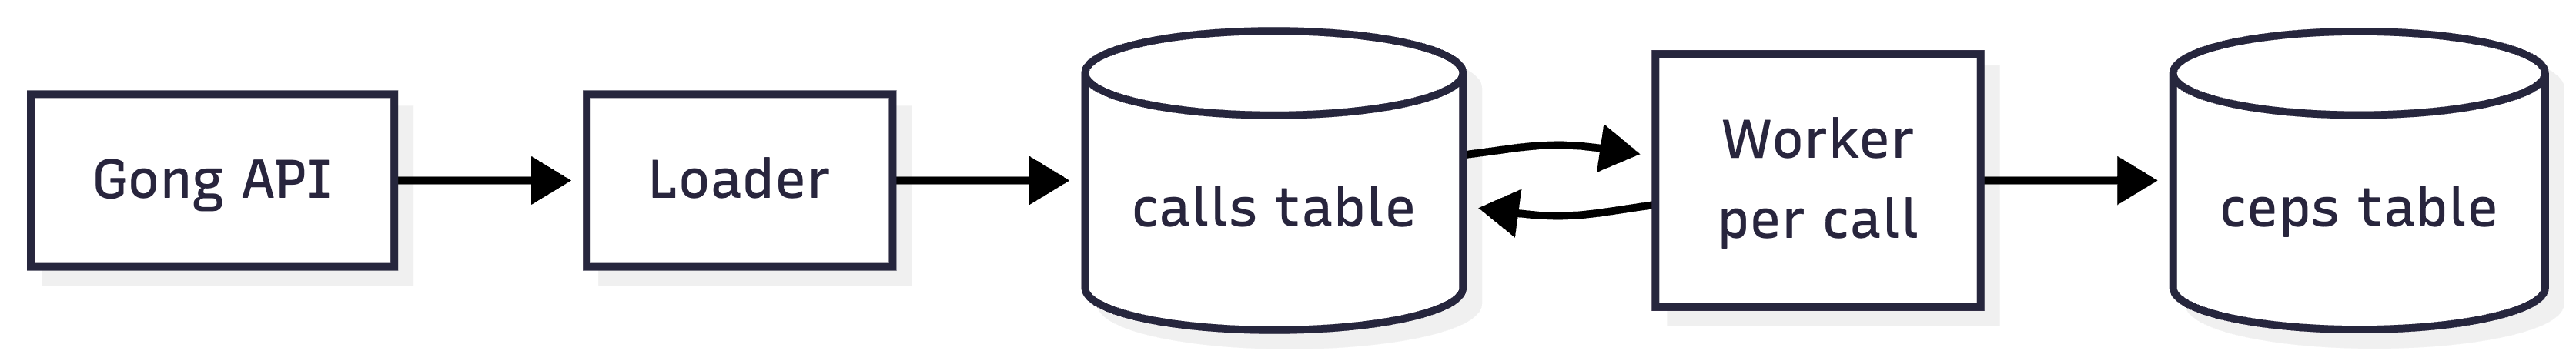
This workflow uses a Loader-Worker pattern with a table at the center. My pipeline runs on Retool, but you could equally use any automation platform that supports API calls, database writes, and LLM steps (n8n, Zapier, Make, etc.).
The Loader pulls new calls from Gong on a schedule, filters to the ones we care about, and writes them to a
callstable.The Worker runs per-call, pulls the transcript, asks an LLM to identify the CEPs according to a structured taxonomy, and writes them to a
cepstable.
This architecture gives you a number of critical benefits:
Accuracy: If you dump 200 calls into an LLM and ask for a synthesis, you’ll get an unreliable and heavily-sampled mess. By reviewing each call one at a time with a taxonomy, you get standardized insights.
Scalability: Loader/Worker is one of my most frequently-used patterns because it parallelizes the most intensive processing (the LLM analysis) and isolates each call into its own workflow run. This works well even at high volumes.
Reliability: This task doesn’t need a lot of autonomy. It needs to be reliable. By making 90% of the workflow deterministic, we gain control and easy error handling, and we the LLM offer value where we need it to.
Let’s look at each step in detail.
The Loader
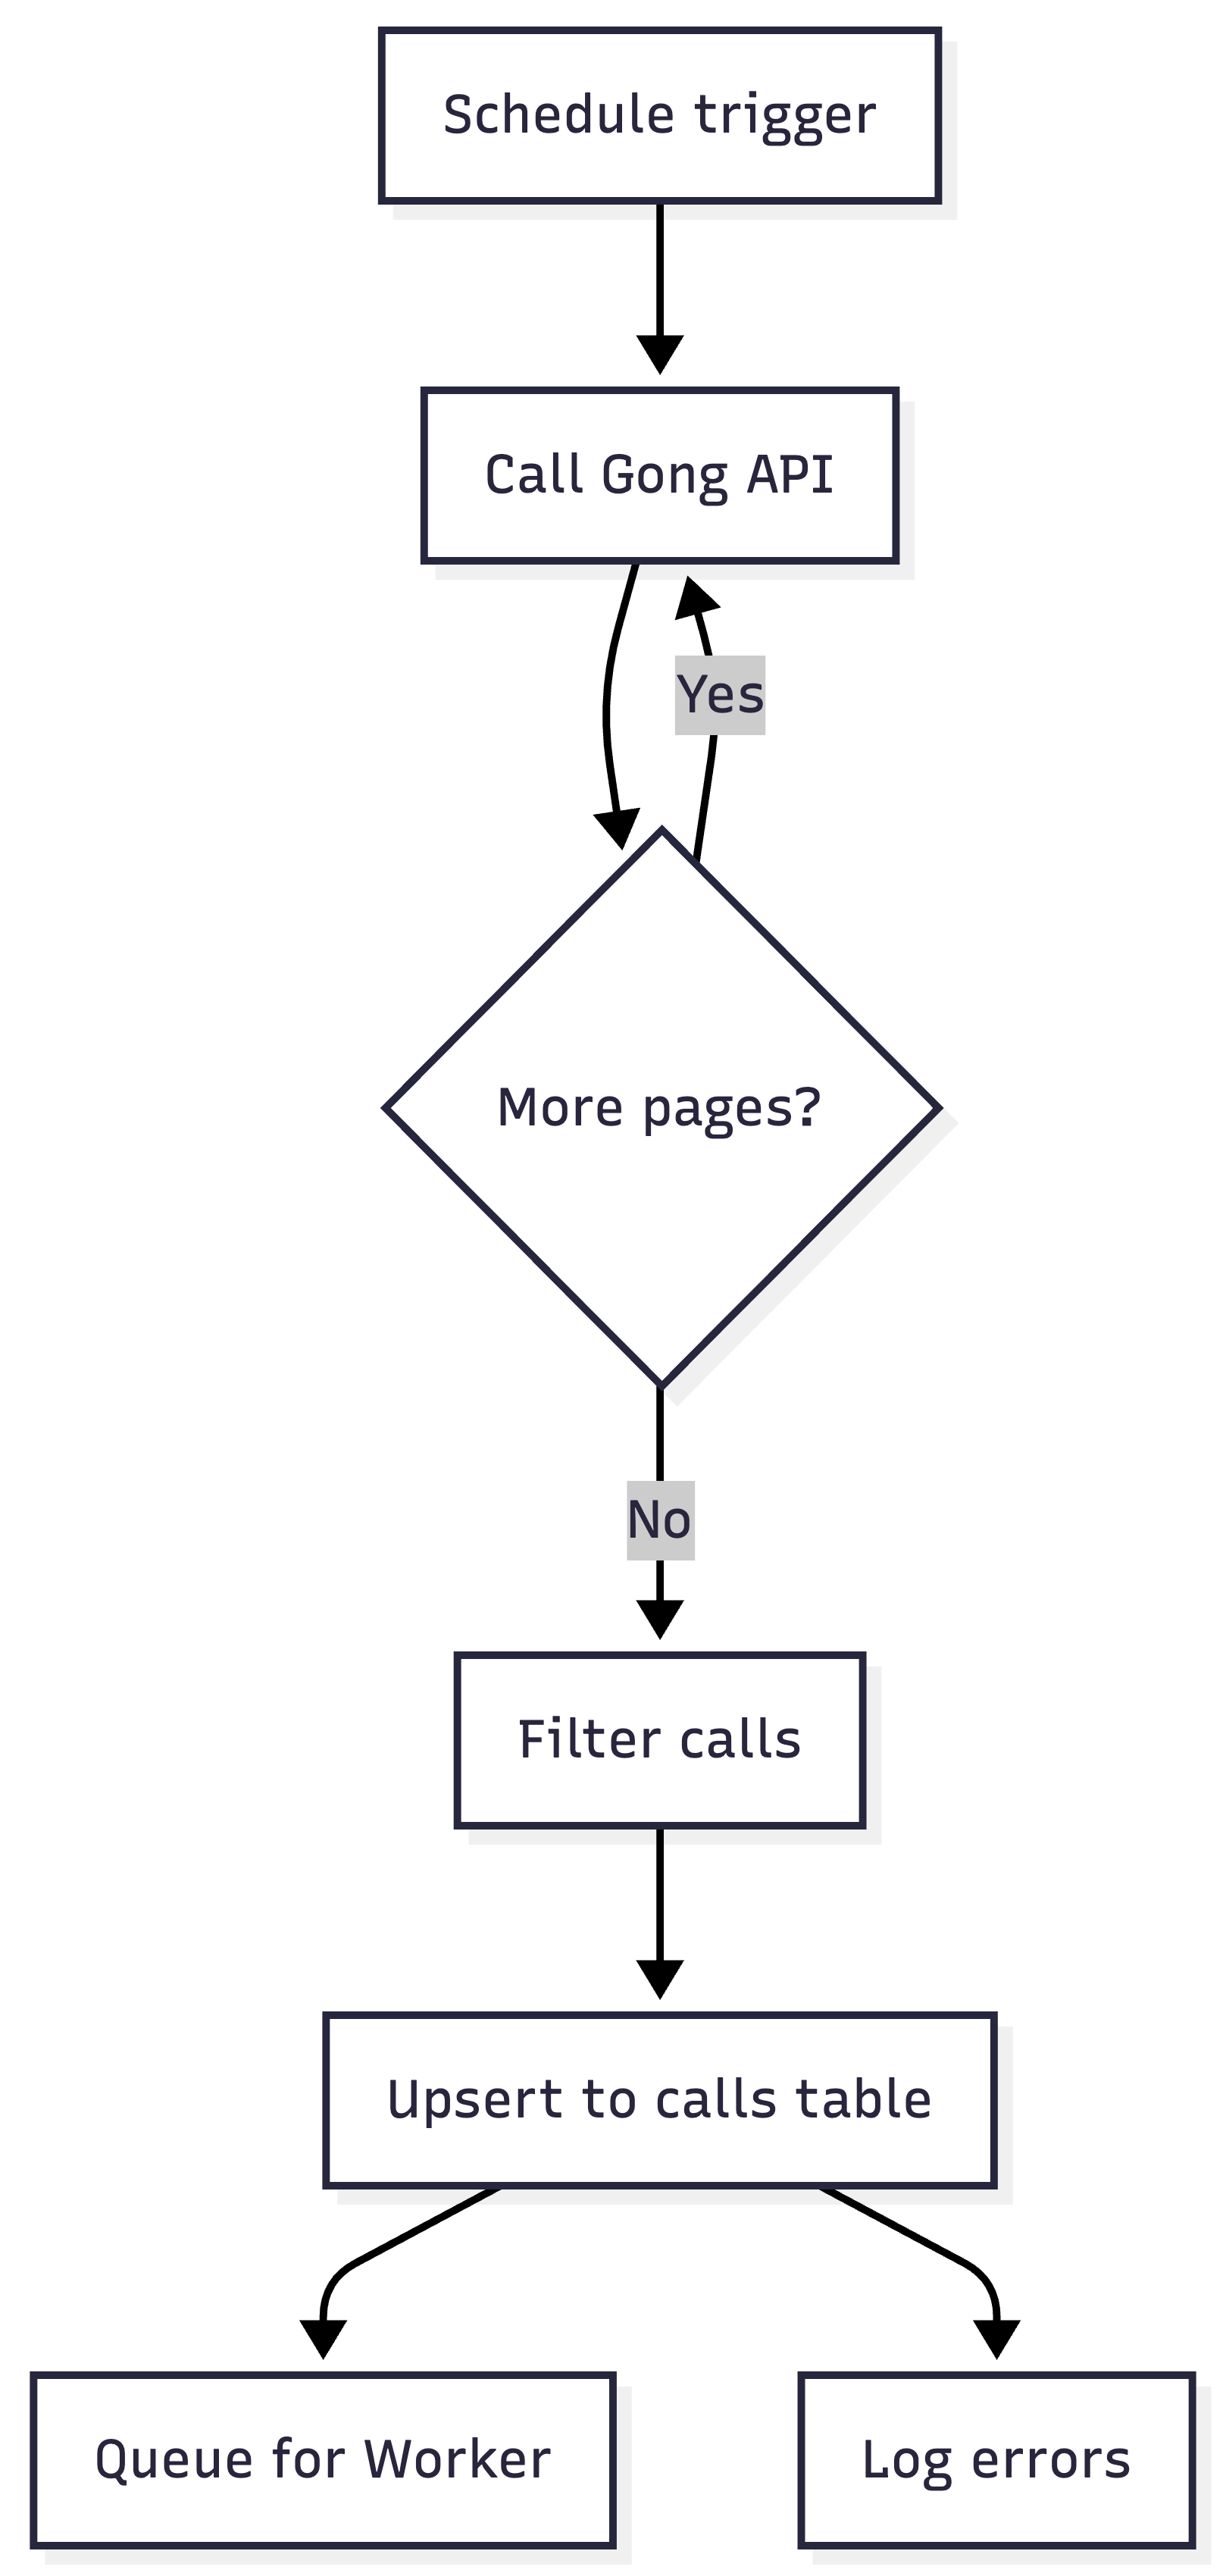
The Loader is pure, deterministic plumbing. It just gets the new calls and puts them in a table.
Trigger on a schedule (daily or hourly).
Call the Gong API with a date range, paginated.
Filter the results down to the calls you actually care about — specific trackers, specific call types, specific pipeline stages.
Upsert each call into the
callstable with a status field (pending,processing,done,failed).Queue each new
pendingcall for the Worker.Log any failures to a dedicated errors table so you can see what broke without stalling the pipeline.
There are really just two tricky parts to this that you need to handle:
Pagination
If you have more calls returned in your date range than will fit on a single page of API results, you need to paginate to get everything.
Depending on your workflow tool, this can require additional config. n8n has a built-in pagination feature. In Retool, you can wrap your API request in a code function that handles pagination for you. Zapier requires you to recursively call a Zap until no more results appear.
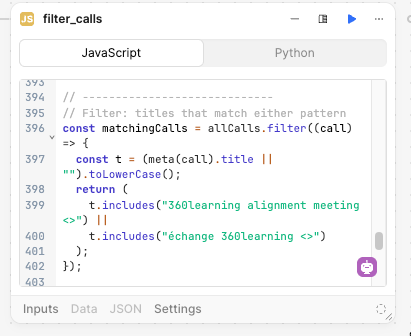
Identifying the right calls
Gong’s API has limited filtering capabilities, so you need to retrieve ALL calls in the date range then use code to filter down to the calls that you care about.
If you can identify those calls with a tracker, this is easy.
Otherwise you may need to filter on things like the meeting name.
This is where having a structured process will help you. If your team is creating their own discovery calls willy-nilly with random names, it will be hard to filter down. You may need to hard-code rep names and maintain them manually, which is a bad solution.
We got around this by ensuring all discovery calls are created via Chili Piper with a standard naming convention. Then we can filter on this predictable string.
The Worker
The Worker is where the LLM work happens, and it runs for each call asynchronously. This keeps errors contained and enables the workflow to run at scale. Whether you have 10 or 1,000 calls a day, each Worker run processes only one call at a time, using the table as a queue.
It looks like this:
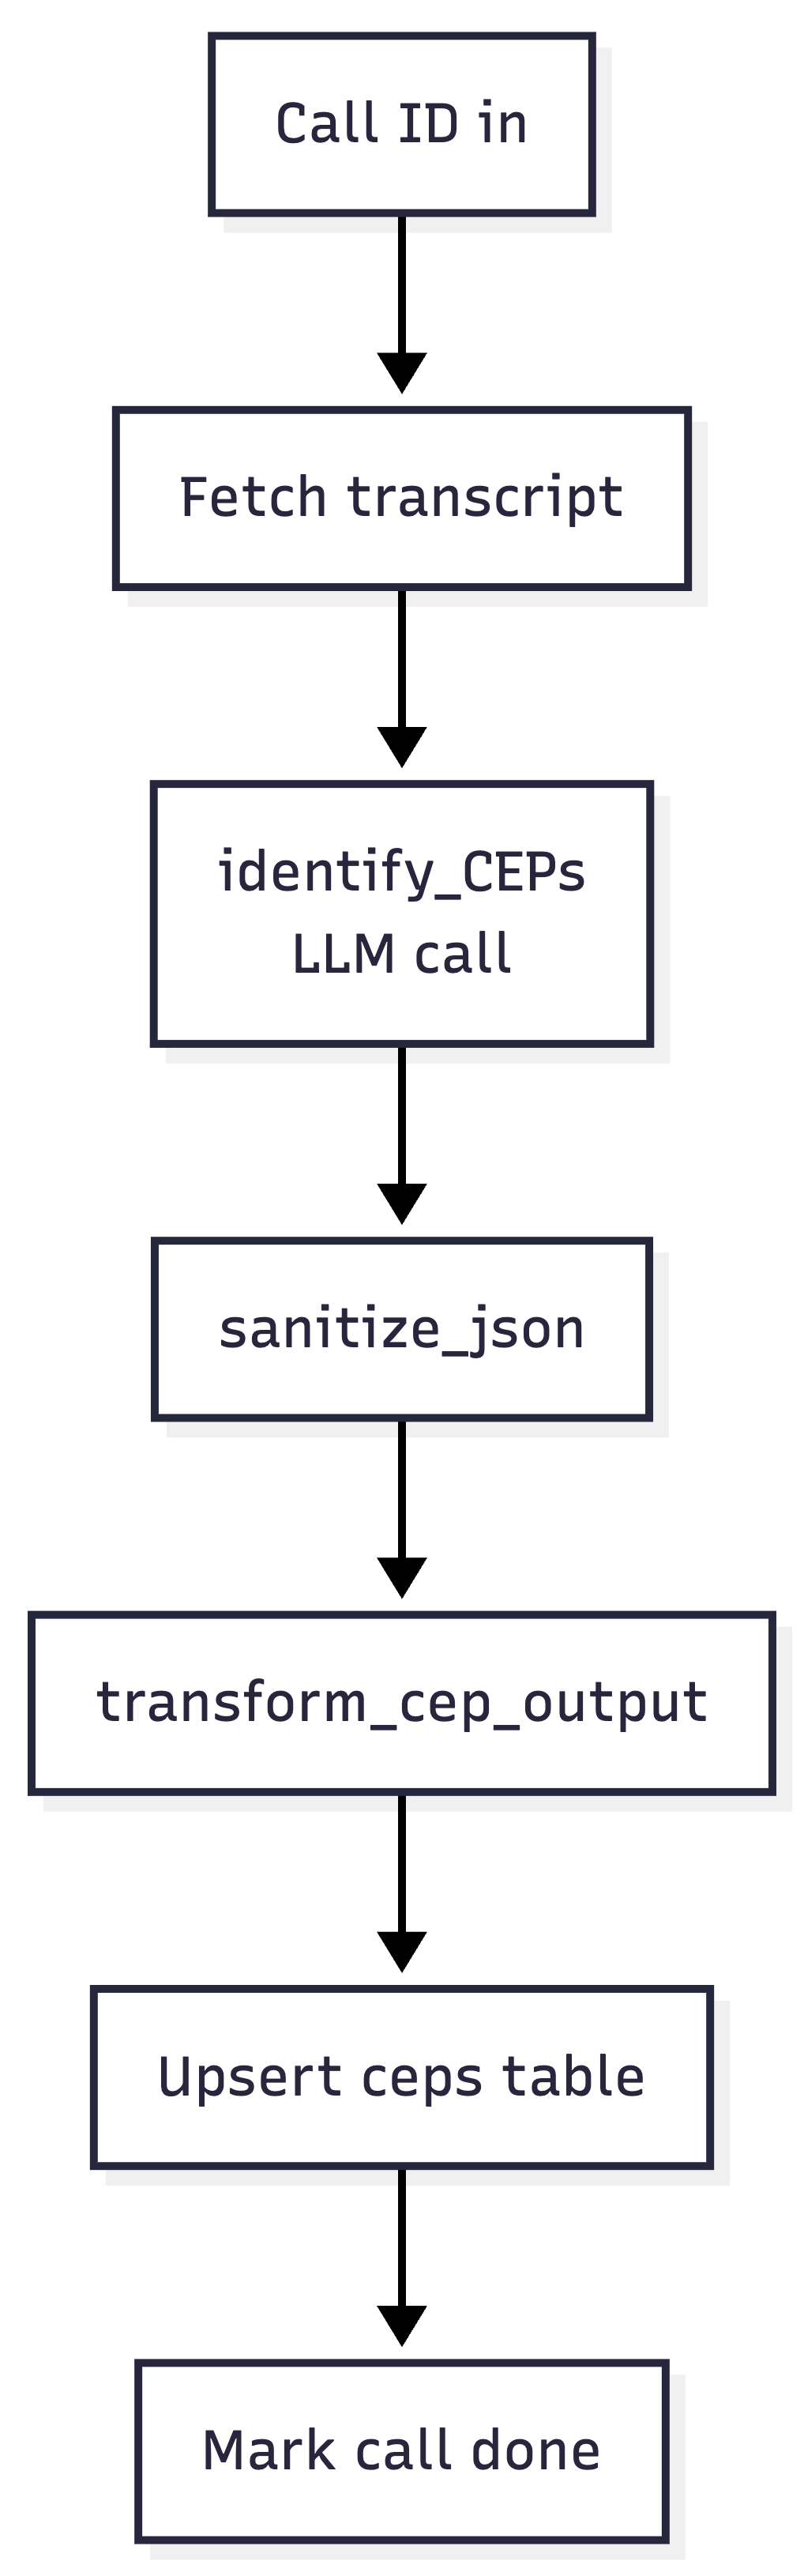
A few things worth calling out:
One job per LLM call. The identify_CEPs step does exactly one thing: given a transcript and the current CEP taxonomy, return a structured JSON object with primary CEP, secondary CEPs, evidence quotes, and confidence scores.
My observation is that the quality of insight you receive is directly related to how focused the LLM’s attention is on a specific goal. Decomposing your LLM tasks remains one of the most important ways to get quality.
Sanitize your JSON. LLMs return “almost valid” JSON, but a trailing comma, a smart quote, or a code fence leaked into the output will break your downstream parsing. The sanitize_json step is a small utility that tries to parse, and if it fails, runs a handful of deterministic cleanup passes before trying again.
Transform before writing. The LLM doesn’t know about your database schema, and you don’t want it to. transform_cep_output takes the sanitized JSON and shapes it into rows that match the ceps table.
Update the calls table at the end. Mark rows as “done.” This is where you reap the benefits of a stateful table. A call stuck in “pending” can be retried via another safety net workflow, and a single failure has no effect on other calls.
Here’s the prompt for the LLM to identify CEPs (continuing to use our example of an AI CRM)
Analyze the following sales call transcript to identify all Category Entry Points (CEPs) that triggered this prospect to start evaluating a new CRM solution.

CALL TRANSCRIPT:
{{ get_call_transcript.data.callTranscripts }}

CALL METADATA:
- Call ID: {{ params.id }}

YOUR TASK:
1. Read the entire transcript carefully
2. Identify ALL situations/needs that caused them to start looking for a CRM
3. Classify each CEP using the taxonomy provided in your system instructions
4. Determine which CEP is PRIMARY (the main trigger) vs SECONDARY
5. Extract direct quotes as evidence for each CEP
6. Flag any CEPs that don't fit the taxonomy

OUTPUT FORMAT (JSON):
Return a valid JSON object with this exact structure:

{
  "call_id": "{ID}",
  "analysis_summary": "One paragraph summarizing what triggered this prospect to search for [our category]",
  "ceps_identified": [
    {
      "classification": "current_crm_limitations",
      "category": "System Dissatisfaction",
      "confidence": "high",
      "primary": true,
      "summary": "Prospect's current CRM (Microsoft Dynamics) lacks reporting capabilities and has poor UX, making it difficult to forecast pipeline. Contract is up for renewal, creating natural evaluation window.",
      "evidence_quotes": [
        "our current system just doesn't give us the reporting we need",
        "the user experience is really clunky",
        "contract is up in December so we're looking at alternatives"
      ]
    },
    {
      "classification": "company_growth",
      "category": "Growth & Scale",
      "confidence": "medium",
      "primary": false,
      "summary": "Company grew from 50 to 250 employees in 18 months. Current CRM implementation no longer fits their needs.",
      "evidence_quotes": [
        "we've grown really quickly",
        "current CRM setup is becoming a bottleneck"
      ]
    }
  ],
  "key_insights": [
    "Primary trigger is system dissatisfaction + contract timing",
    "Growth is accelerating the pain but isn't the root cause",
    "Forecast visibility is the specific pain point leadership cares about"
  ]
}

IMPORTANT RULES:
- Return ONLY valid JSON, no additional text
- Include at least 1 CEP (most calls have 2-4)
- Always mark exactly one CEP as "primary": true
- Use direct quotes from the transcript as evidence
- If you're unsure about a classification, put it in "unclassified_ceps"
- "summary" should be 2-3 sentences explaining the CEP in context
The missing piece: where does the taxonomy come from?
The prompt inside identify_CEPs is only useful if it has a taxonomy to classify against. Without one, you’d get wildly inconsistent outputs. For example, one call might get tagged with “cost concerns,” another with “pricing issue,” another with “budget pressure,” all describing the same CEP. You can’t do anything useful with that.
The LLM can help you identify your taxonomy with less subjectivity and effort than running a bunch of internal meetings.
Here’s how to let the data tell you. There are three steps:
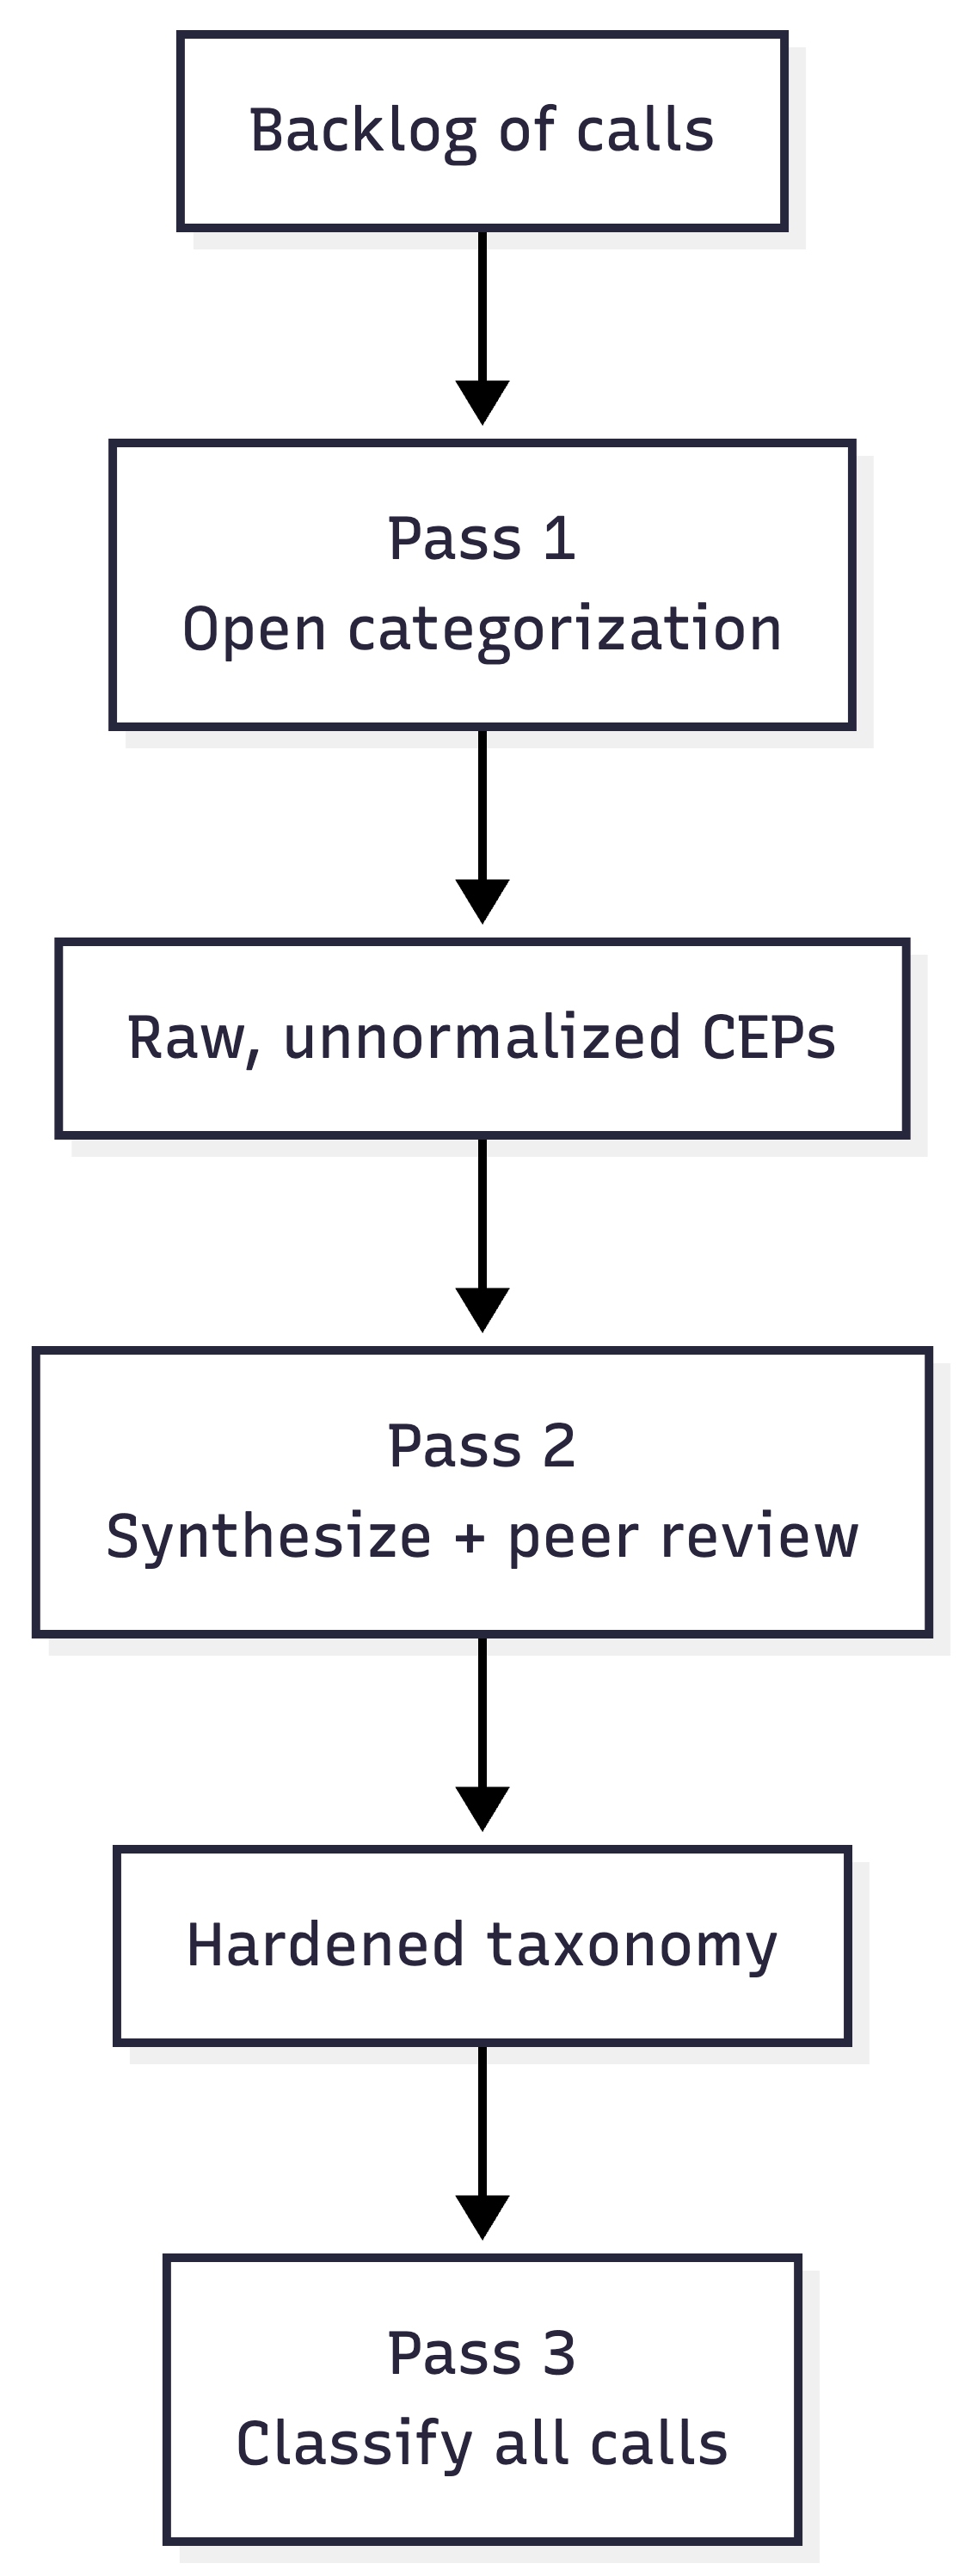
Step 1: Open categorization
Loop over a backlog of a few hundred calls with a prompt that asks the LLM to name and describe the CEP(s) it hears in each call, without a fixed list. You’re giving it permission to use whatever words seem right.
The output will be useful but messy. You’ll have “legacy system hate,” “current tool frustration,” and “CRM doesn’t work for us,” all describing roughly the same thing. That’s fine. You’re not trying to get the answer here; you’re trying to get the raw material.
Step 2: Synthesize and peer review
Feed the full list of raw CEPs into an LLM and ask it to produce a normalized, MECE taxonomy: mutually exclusive, collectively exhaustive. Do multiple passes.
Then, ask a different model (or the same model in a clean context window) to peer review the taxonomy. Poke holes. Identify overlaps. Flag missing categories. Ask it to argue against the grouping.
At this stage you can also validate the taxonomy with internal stakeholders (leadership, product marketing, experienced sales ICs). But you’re asking them to react to something 90% complete as opposed to fill in a blank canvas.
Step 3: Classify at scale
Now that you have a hardened taxonomy, bake it into the prompt in identify_CEPs and re-run the Worker against your full backlog.
From this point forward, every new call that comes in gets classified against the same taxonomy, and the ceps table grows over time into a durable asset.
Here’s an example of a taxonomy for our fictitious AI CRM.
AI CRM CATEGORY ENTRY POINTS TAXONOMY

1. SYSTEM DISSATISFACTION
- legacy_crm_friction: CRM is clunky, slow, unintuitive; reps avoid using it
- low_adoption_problem: Sales team not logging activity, poor hygiene, incomplete data
- manual_data_entry_burden: Too much admin work; reps spending time updating fields instead of selling
- reporting_limitations: Inability to get reliable pipeline visibility or forecasting
- integration_fragility: CRM doesn’t connect cleanly to other tools (marketing, product, support)
- vendor_stagnation: CRM feels outdated; vendor not innovating meaningfully
- support_and_customization_pain: Requires constant admin work, expensive consultants, brittle configs

⸻

2. AI & AUTOMATION GAP (Core Differentiator)
- desire_for_ai_assistance: Want AI to assist reps with notes, follow-ups, deal insights
- workflow_automation_need: Repetitive sales processes not automated (routing, enrichment, tasking)
- signal_detection_gap: Missing key buying signals (intent data, product usage, engagement)
- pipeline_intelligence_need: Lack of proactive insights (deal risk, next best action, forecasting confidence)
- data_capture_automation: Desire for automatic call logging, email syncing, activity capture
- agentic_sales_support: Interest in autonomous or semi-autonomous agents handling parts of sales workflow

⸻

3. GROWTH & SCALE
- sales_team_scaling: Adding reps exposes process inconsistency and CRM breakdowns
- pipeline_complexity_growth: More deals, longer cycles, harder to track accurately
- multi_segment_sales: Expansion into enterprise, SMB, or new verticals requires better tracking
- global_sales_expansion: Multiple regions, territories, currencies complicate CRM usage
- manager_span_of_control: Managers can’t effectively oversee larger teams with current tools

⸻

4. REVENUE VISIBILITY & FORECASTING
- forecasting_inaccuracy: Forecasts unreliable; leadership lacks confidence in numbers
- pipeline_blindspots: Lack of clarity into deal stages, risks, or slippage
- board_pressure_visibility: Increased scrutiny from leadership/board on revenue predictability
- data_trust_issues: CRM data not trusted due to poor hygiene or manual entry gaps
- real_time_insight_gap: Inability to get up-to-date pipeline insights quickly

⸻

5. GO-TO-MARKET TRANSFORMATION
- plg_motion_adoption: Need to incorporate product usage signals into sales workflows
- multi_channel_sales: Coordinating inbound, outbound, partnerships, and product signals
- customer_journey_unification: Desire to unify marketing, sales, and CS data into one view
- modern_sales_motion: Moving from relationship-based to signal-based selling
- sales_methodology_shift: Moving to MEDDICC, SPICED, etc., requiring better tooling

⸻

6. DATA & SIGNAL PROBLEMS
- fragmented_data_sources: Data spread across tools (CRM, product, marketing automation, support)
- poor_data_quality: Duplicate accounts, outdated contacts, inconsistent fields
- identity_resolution_gap: Difficulty tying users to accounts or consolidating account hierarchies
- intent_data_underutilization: Buying signals exist but aren’t actionable
- enrichment_dependency: Heavy reliance on third-party enrichment with inconsistent quality

⸻

7. SALES PRODUCTIVITY & EFFICIENCY
- rep_time_misallocation: Too much time on admin vs. selling
- slow_follow_up_cycles: Leads not contacted quickly or consistently
- task_management_breakdown: Reps miss follow-ups, lack structured workflows
- playbook_enforcement_gap: Sales processes defined but not followed
- tool_overload: Too many disconnected tools in the sales stack

⸻

8. ORGANIZATIONAL CHANGE
- new_sales_leadership: New CRO/VP Sales wants to overhaul systems/processes
- revops_restructure: Centralization or formalization of RevOps function
- merger_acquisition: Need to consolidate CRMs or unify data models
- strategic_revenue_initiative: Company-wide push for growth, efficiency, or predictability

⸻

9. CUSTOMER EXPERIENCE & HANDOFFS
- poor_sales_cs_handoff: Information lost between sales and customer success
- account_visibility_gap: No unified view of customer interactions across lifecycle
- renewal_risk_blindspots: Lack of visibility into post-sale engagement signals
- customer_journey_fragmentation: Disconnected experience across touchpoints
- upsell_cross_sell_missed: Missed expansion opportunities due to lack of insight

⸻

10. COST & STACK RATIONALIZATION
- crm_total_cost_burden: High licensing, admin, and consulting costs
- tool_consolidation_initiative: Desire to reduce number of tools in GTM stack
- inefficient_stack_roi: Paying for tools that don’t deliver value
- admin_headcount_pressure: CRM requires too many dedicated resources to maintain
- vendor_lock_in_fatigue: Frustration with expensive, inflexible incumbents

⸻

11. COMPETITIVE PRESSURE
- peer_stack_comparison: Hearing competitors use more modern/AI-driven tools
- lost_deal_postmortem: Losing deals due to poor follow-up or lack of insight
- benchmarking_gap: Realizing internal processes lag industry best practices
- investor_pressure_modernization: Pressure to modernize GTM systems and data stack

ANALYSIS PRINCIPLES:
- Most calls will have MULTIPLE CEPs - identify all of them
- One CEP is typically PRIMARY (the main trigger), others are SECONDARY
- Use DIRECT QUOTES as evidence whenever possible
- If a CEP doesn't fit the taxonomy, flag it for human review
- Confidence levels: "high" (explicitly stated), "medium" (strongly implied), "low" (inferred)
- Focus on what triggered the SEARCH, not what they want in a solution
One more thing that matters: the prompt is designed to put CEPs that don’t fit your taxonomy into an “unclassified” category. You should plan to review these periodically — quarterly, maybe — to ensure your taxonomy isn’t getting stale. You can also demote CEPs that no longer show up.
What the output looks like
Once the CEP table has been running for a while, it becomes something you can actually query. For a hypothetical AI-first CRM, a rough picture of the output might look like this:
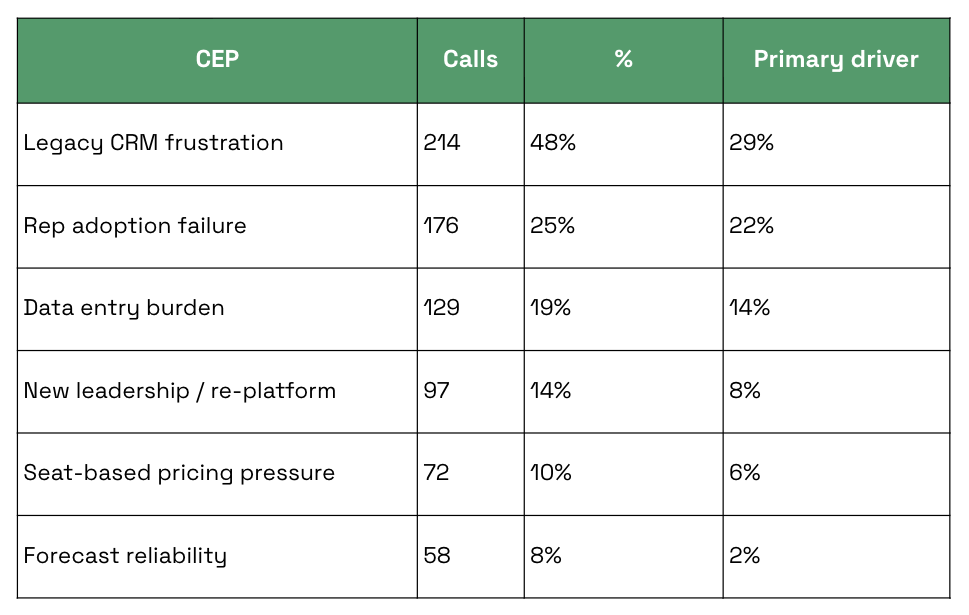
(Numbers are illustrative.)
Now you can have a real conversation.
Which CEPs are overrepresented in closed-won deals versus closed-lost?
Which ones correlate with larger deal sizes?
Which ones are growing quarter over quarter?
Which ones are we currently saying nothing about in our messaging?
CEPs also provide a way to provide specific, valuable context to your asset creation workflows. If you ask an LLM, “generate a landing page based on this messaging doc,” you’ll tend to get generic slop.
If you say, “generate a landing page based on this messaging doc, for this category entry point, and here’s several dozen transcript excerpts of buyers describing this exact problem",” you’ll get messaging tailored to the actual language your buyers use in this scenario.
What actually happened when we built this
This actually started as an informal prototype, not a defined project. I built the first version to back up a presentation about brand strategy for a marketing offsite.
But once the CEP taxonomy existed, other people started reaching for it.
The CEPs became an input to redefining our ICP. They became a consideration when building landing pages or ad briefs. My CMO started referring to them in conversations. The concept became part of the information fabric the team makes decisions from.
We also now have a baseline we can measure from to identify whether our efforts to associate our brand with specific CEPs is effective or not. This solves for brand measurement, one of the trickiest parts of B2B marketing.
The bigger point
Marketing is one of the business functions that is most susceptible to AI slop. But AI, used thoughtfully, can deliver a ton of value.
The main benefit here is doing analytical work at scale — making the qualitative quantitative.
Your PMM team only has time to listen to so many calls. But an LLM can listen to all of them and produce a foundation that manual human judgement can build on.
If you’re supporting a GTM team, this is one of the highest-leverage things you can put your time into. It’s infrastructure that makes everyone you support smarter about the bets they’re making.
Romaniuk & Sharp, “Building Mental Availability,” Journal of Advertising Research, 2016; WARC / Effie Australia, “The Effectiveness Code,” 2020.
I think you need to reassess this with dynamic workflows having launched
this is awesome justin, and super informative! i appreciate the level of depth you went into, a lot of people underestimate the time it takes, iterations, and learnings put into a process like this.