

Documenting with AI (part 2): data flow diagrams
How to generate clean and maintainable diagrams in minutes with Mermaid


Diagrams are the mark of a pro. They give that crisp, high-level overview of a project that anyone can understand.
Especially today—as more teams lean in to “build” over “buy” and systems and stacks grow ever more complex—there’s a critical need for a shared mental model, something anyone can grok at a glance.
Any systems person will know the pain of rooting around for answers that should’ve been obvious (“what updates this field?!”). In the worst case, a system becomes so opaque that people give up on it entirely and rip it out.
But diagramming takes time…
So quite often, they don’t get done.
And even if diagrams DO get made, they can be hard to maintain and can easily go stale because:
source files get lost
creating crisp diagrams is a discrete skill, which not everyone has in equal measure
tools like Lucidchart are great but can be time-consuming and fidgety if a complex diagram needs to be updated
Enter Mermaid
Recently, I discovered the potential of Mermaid, an open-source JavaScript based diagramming tool.
It lets you create diagrams using code, which makes them easier to edit and maintain. Instead of hunting down the original diagram file or redrawing everything, you can just tweak the code and regenerate the chart.
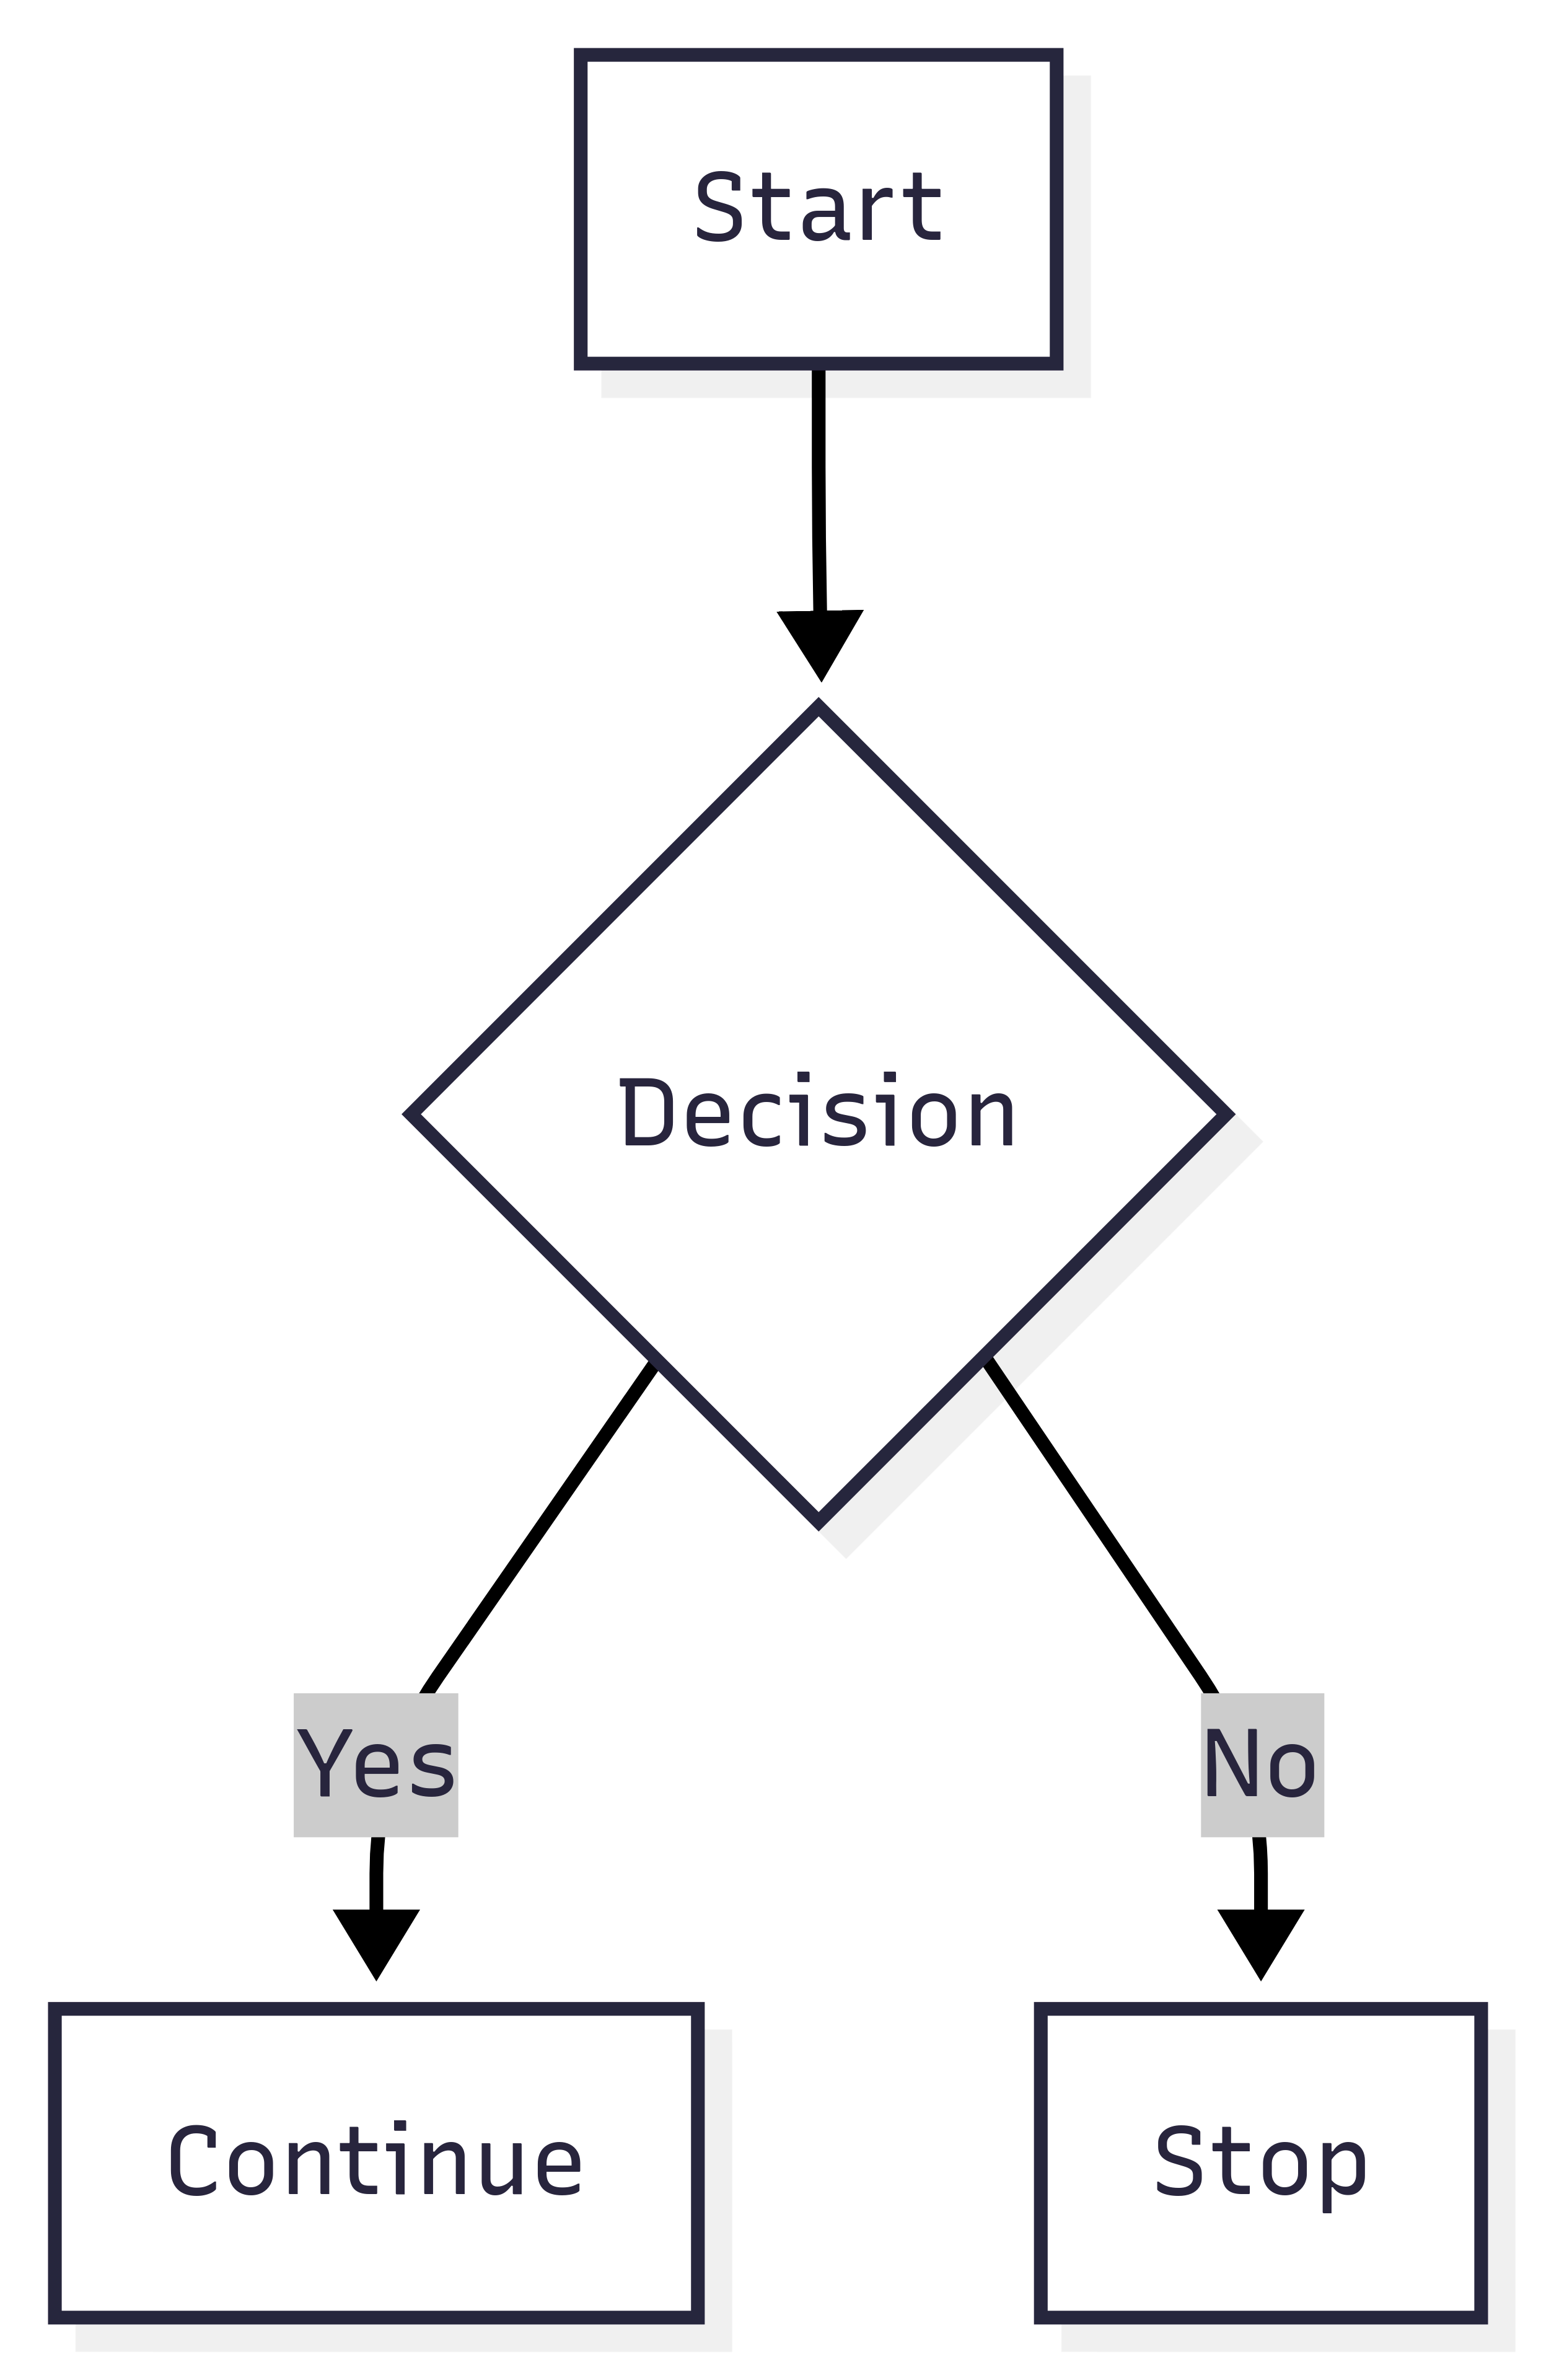
Here’s an example Mermaid snippet:
graph TD
  A[Start] --> B{Decision}
  B -->|Yes| C[Continue]
  B -->|No| D[Stop]
And here’s the resulting diagram:
That said, this approach introduces a new barrier: now you have to learn the syntax of Mermaid. And unless you’re creating multiple diagrams a week, you probably ain’t got time or motivation for that.
But AI takes that friction away too.
Generating Mermaid diagrams with AI
Mermaid actually includes an AI feature where you can describe your diagram in natural language, and it’ll generate the code for you. That’s a big step forward, but it still requires you to describe what you want.
The next evolution is for the LLM to both write the diagram code AND define a first draft of what the diagram should be based on its own understanding of your project.
If you're using ChatGPT Projects, as I described in this post, then you’re already halfway there. Once the LLM has synthesized your documentation and built a clear written representation of the project, it has everything it needs to generate a visual synthesis, too.
Then it can write the code to generate a Mermaid diagram automatically.
This took me about five minutes using Gemini 2.5 Pro and only a few iterations.
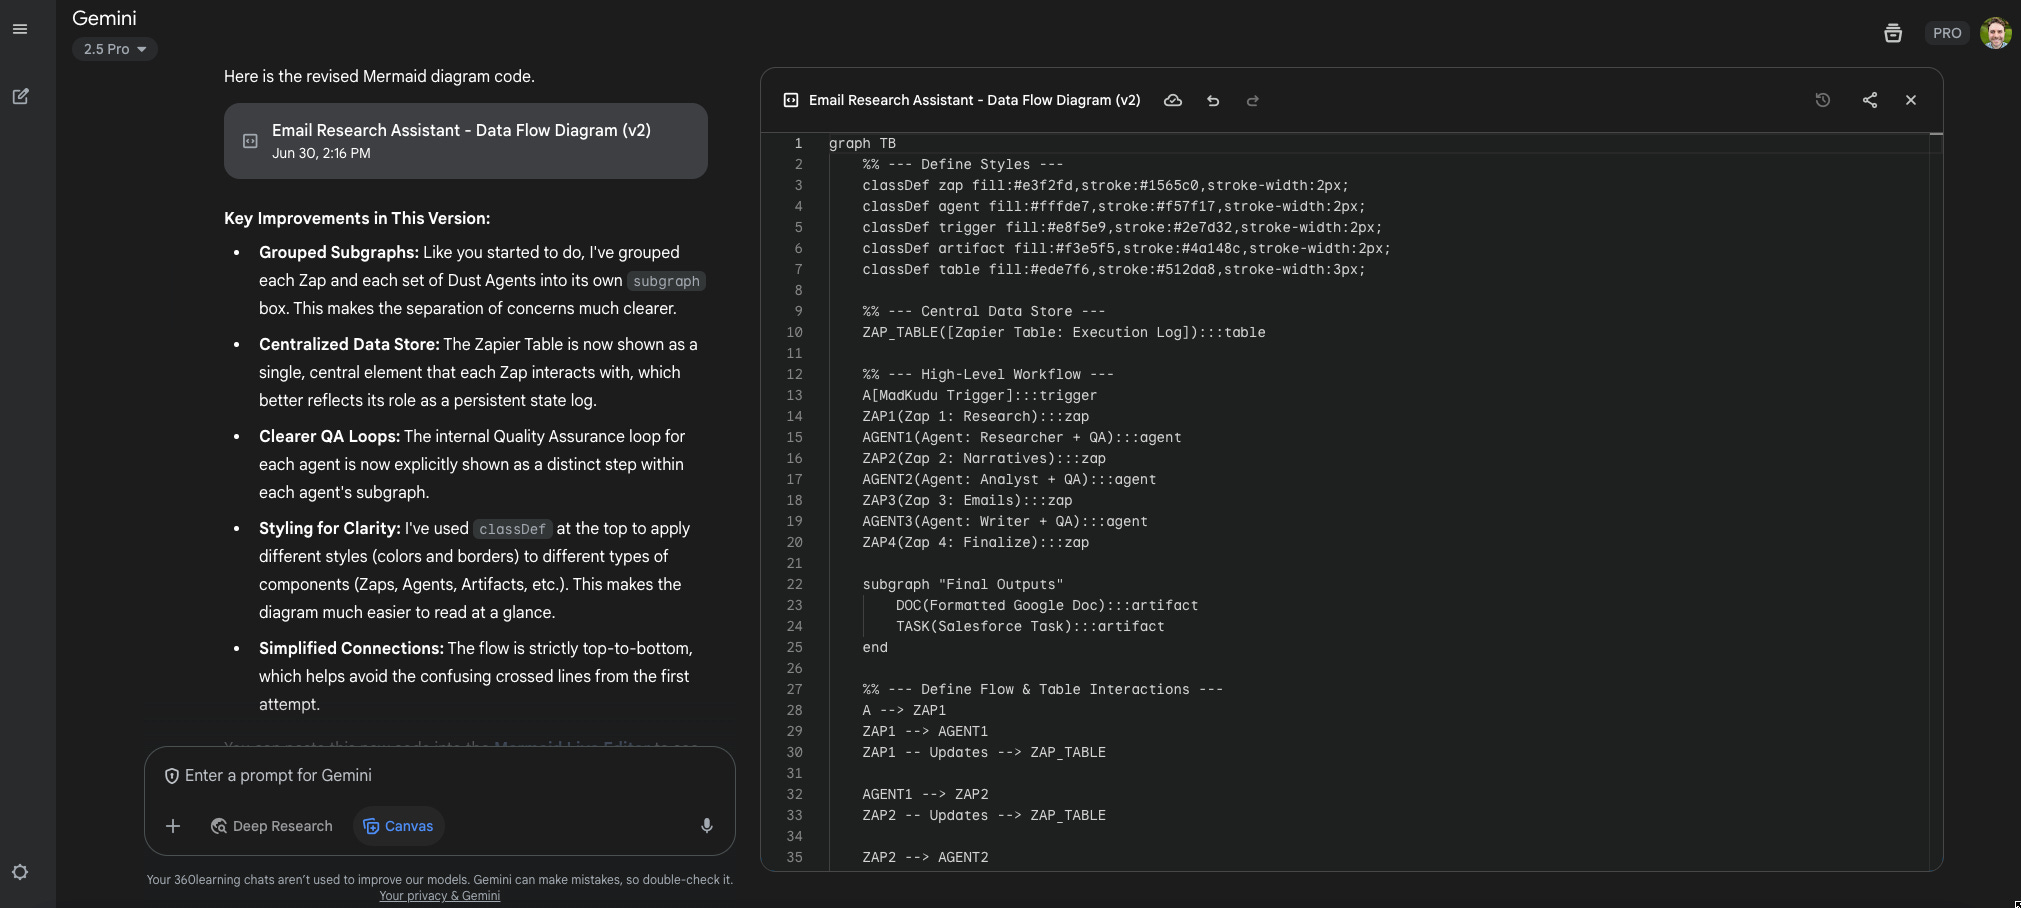
You can then take that code, paste it into the code generator of a Mermaid tool, and instantly get your diagram.
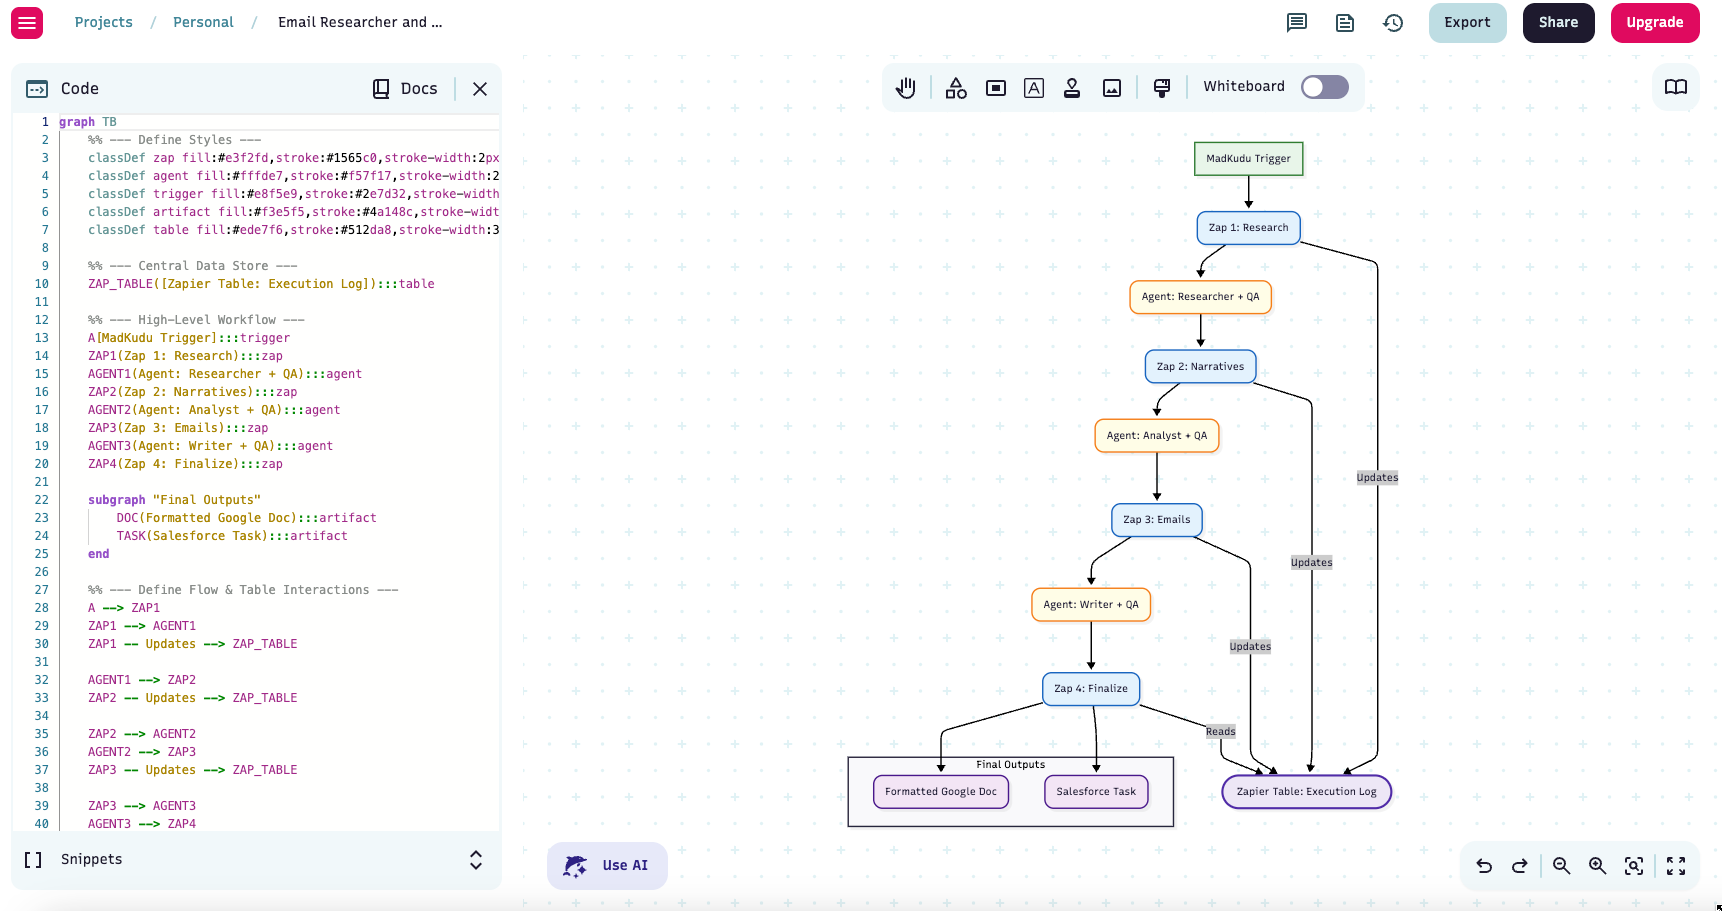
This required a free account at mermaidchart.com.
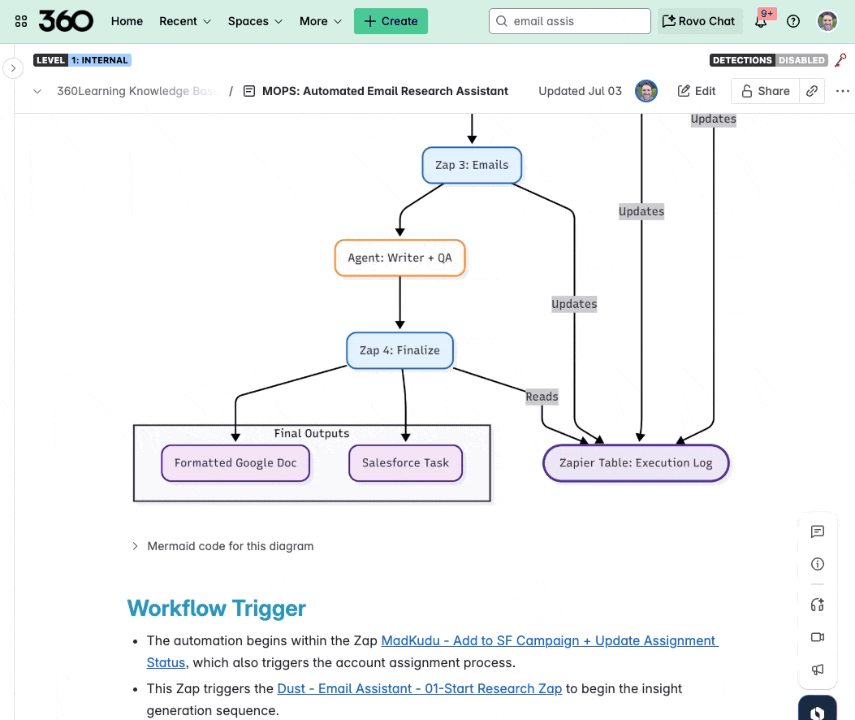
Bonus tip: keep the code with the diagram
To ensure the diagram is always easy to maintain, store the Mermaid code in an expandable widget underneath the diagram in your documentation.
That way, if anyone ever wants to tweak it, they can just copy the code, paste it into an LLM, describe the change, and regenerate the diagram.
Is it a full replacement for tools like Lucidchart?
I don’t think so.
You’ll notice it lacks some of the visual polish of Lucidchart. For scenarios where the aesthetics really count—pre-sales, consulting—then I’d still hand-build a diagram.
But where the goal is clarity and internal knowledge retention, Mermaid seems like an effective and (if you generate it with AI) incredibly efficient option.